Ultrasonic Testing: Defect-Sizing in Composite Structures
Ultrasonic Testing (UT) method is frequently used for non-destructive testing of aerospace structures and components. When inspecting structures made of composite materials, ultrasonic testing provides high-resolution C-Scan images which are used to locate and size defects. The -6 dB drop technique is often applied to the ultrasonic pulse-echo or through transmission C-Scan results in order to perform 2D defect sizing. For the case of ultrasonic testing of composite structures in through-transmission, defect sizing require selecting a reference area from the C-Scan image with relatively constant signal amplitudes and free of defects. However, selecting such a baseline reference is difficult to achieve due to the natural amplitude variation caused by the fiber matrix of composites as well as the presence of small indications or else.
Ultrasonic Testing (UT) method is frequently used for non-destructive testing of aerospace composite structures. Defect-Sizing in these structures using simple -6 dB amplitude drop technique is difficult to achieve.
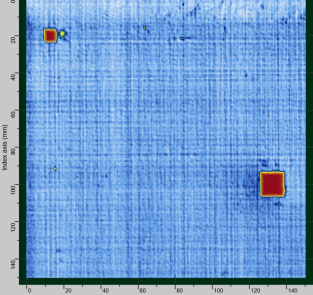
When scanning a composite structure at a high frequency, the internal fiber matrix can be observed in the form of amplitude variation of the ultrasonic waves. The following example shows a 0-90° carbon fiber reinforced plate (CFRP) scanned using an ultrasonic gantry system in through-transmission setup where we can clearly see the fiber alignments.
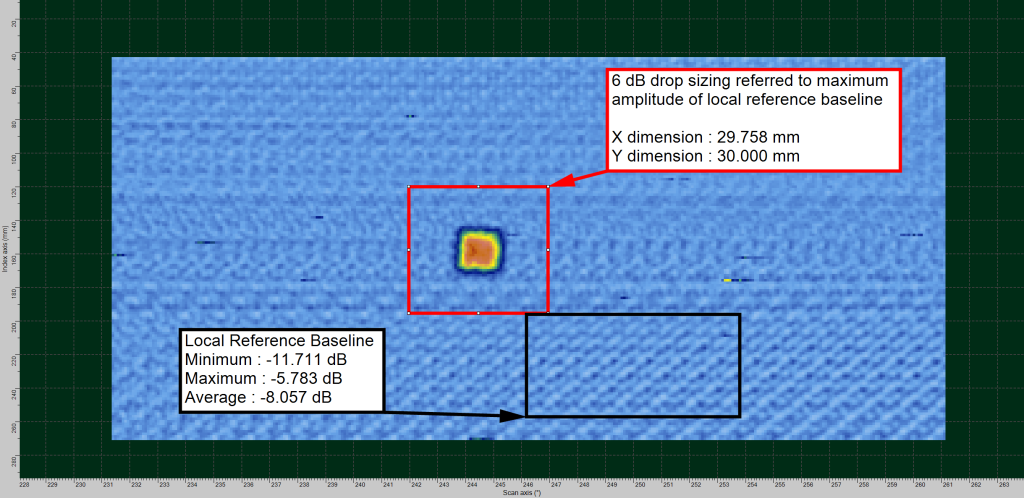
Therefore, it is not the highest nor the lowest amplitude of a defect-free area that best represents the normal ultrasonic response from the material, but rather the average response. And so, if one tries to perform defect sizing based on the -6dB points using the maximum amplitude of a defect-free reference area from a composite structure with visible fibers in the C-Scan, the detected defects will be oversized. The following is an example of defect-oversizing situation in a woven composite structure, where a Teflon® insert of 25x25mm is detected and visible in the C-Scan (scan resolution of ~1.5 mm x 1.5 mm).
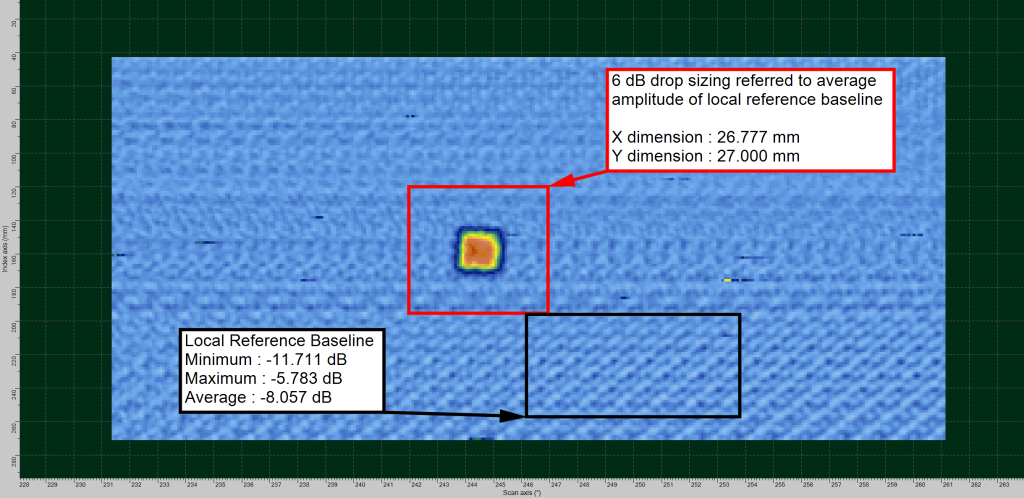
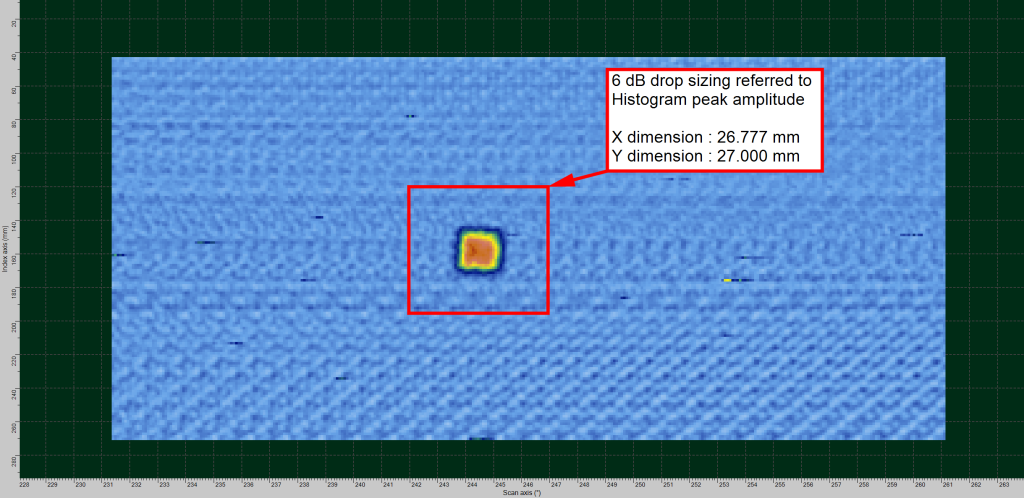
The above result shows defect oversizing when we select the maximum amplitude to apply the 6dB drop sizing. The defect size was overestimated by ~20% on each side. A better approach consists of using the average amplitude of a local reference area, which represents the average response of the inspected structure. The following example shows a significant improvement and close to accurate sizing of the detected defect.
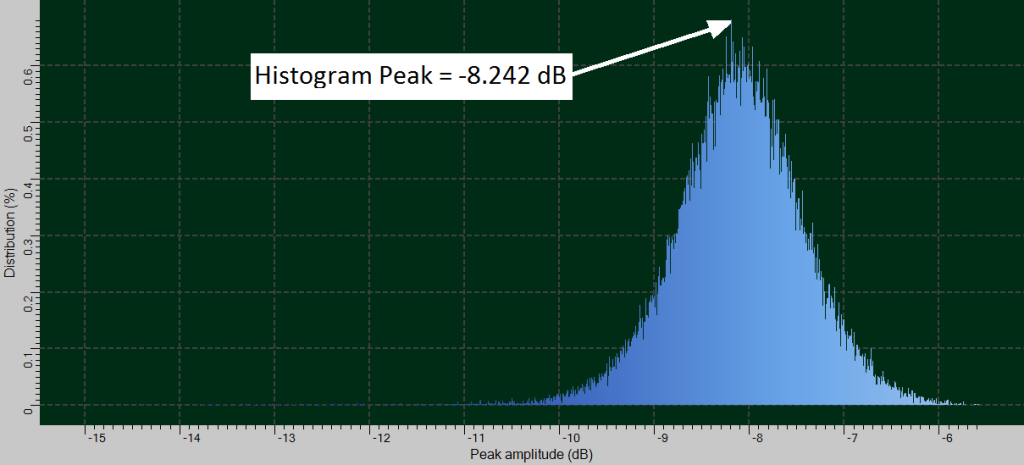
Furthermore robust approach for defect-sizing in this situation, is to use the C-Scan Histogram in order to establish the appropriate reference amplitude level which represents the “normal” or median value of the amplitude response returned by the material.
The advantage of the Histogram approach over the average response of a selected reference area is to remove the inconsistency which may result from an improper selection of a reference area in the C-Scan by the operator. In addition, the Histogram approach is not affected by small variations in the C-Scan such as low amplitude indications from smaller defects, noise or amplitude drops caused by water jet scanning.


